
Oct-Dec 2025Global Insights
A cross-feature reporting experience that turns siloed messaging data into an executive-ready view of health equity impact — proving CareMessage's ROI every time a leader logs in.
About the company
CareMessage is a healthcare technology nonprofit that provides patient communication platforms to 400+ federally qualified health centers, serving millions of underserved patients annually.
01Project Overview
Core Problem
Patient engagement and messaging data was siloed across five separate features - Appointments, Programs, Referrals, Outreach, and Messenger. To understand organizational performance, customers had to jump between tabs, export CSVs from each feature, and manually stitch together a picture. Senior leaders, the people responsible for proving ROI to boards, had no unified view at all.
30%+ of all web-app feedback was reporting-related, the single largest category of customer pain
My role
Led end-to-end UX design
Drove stakeholder alignment on data structure and product packaging
Ensured C-suite users see measurable CareMessage value on login
Solution Summary
A new Global Insights section: a dedicated menu entry point, not bolted onto an existing page that brings all-feature data together through the lens of Health Equity pillars: Access to Care, Clinical Outcomes, and Social Determinants, as well as Patients & Engagement, that provides visibility into the details of existing patients
Data structured to mirror CareMessage's product packages, so what executives see reflects what they purchased
Full CSV export capability of selected date range
02User Challenges & Research Signals
Four user groups were identified as high-priority, each with a distinct unmet need that the fragmented experience was actively blocking.
Senior Leadership
No way to see aggregate organizational performance (messaging volume, engagement, opt-outs) in a single view to report to board members or justify the CareMessage investment.
Clinical Staff
Needed simple, clear dashboards showing patient reach and failed message trends to follow up proactively, but data lived deep inside feature-level reports.
Department Managers
Couldn't track overall patient trends, delivery failures, or engagement without manually exporting from each feature separately, creating workflow inefficiency and increasing cognitive load.
Data Analysts
Required exportable, filterable datasets spanning all features for deeper analysis, but the current patchwork of per-feature CSVs made this time-consuming.
03Design Exploration & Key Decisions
Before jumping to a solution, three fundamentally different design paths were evaluated.
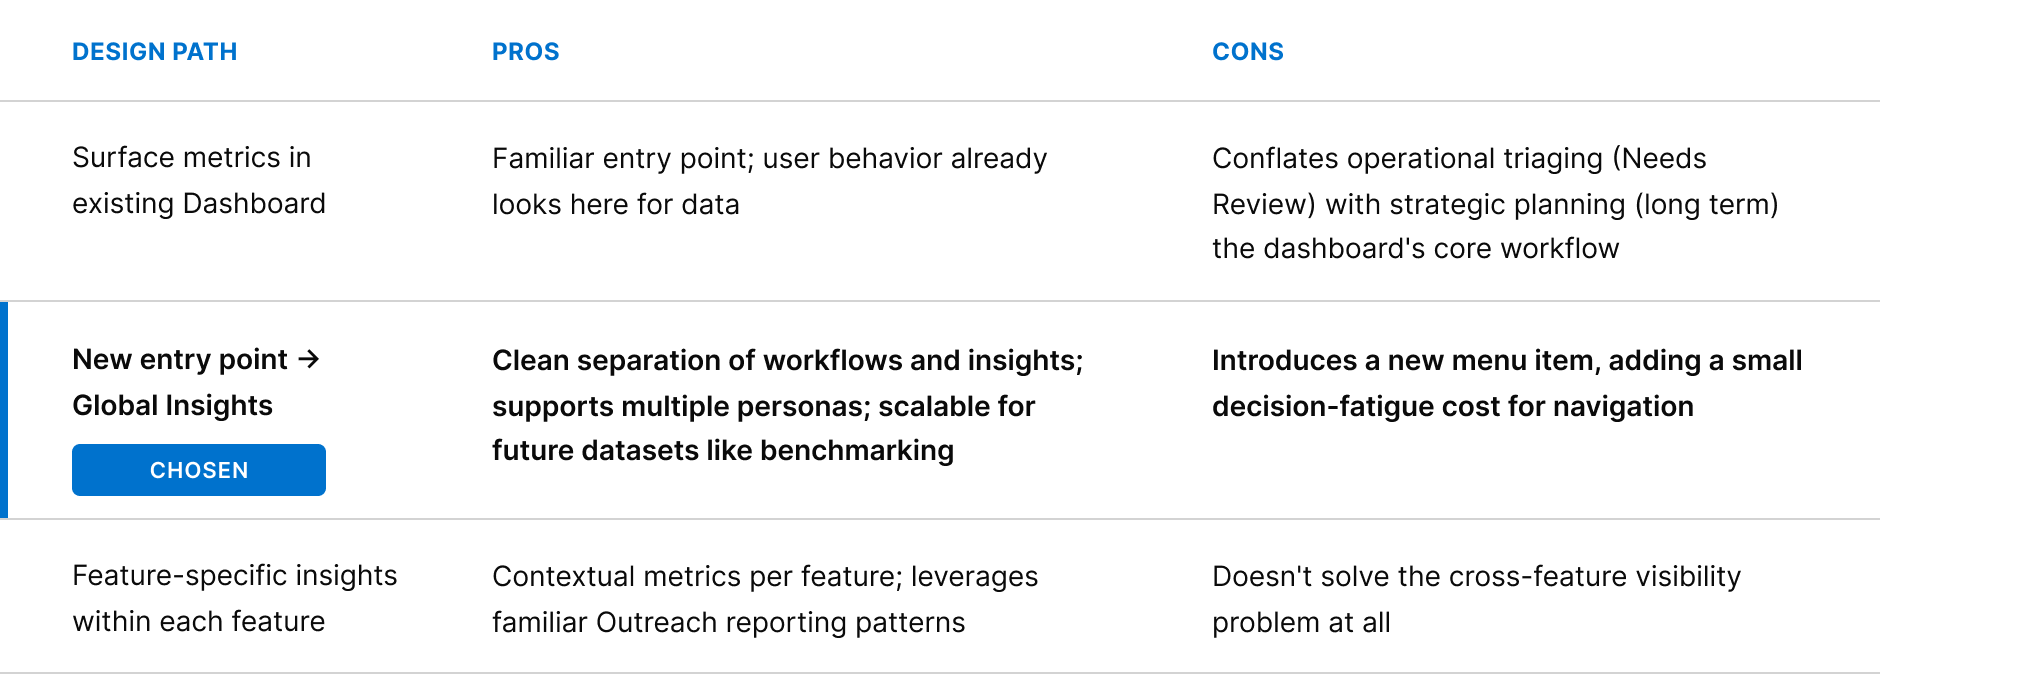
Why I chose a new entry point
Preserves the Dashboard as a Needs Review triage space — a use case strongly validated by customers who rely on it daily for workflow
Directly addresses the 30%+ of feedback specifically requesting better cross-feature reporting
Supports all four core personas with a single destination rather than forcing each to navigate to different feature sections
Scales cleanly for future iterations e.g. benchmarking across organizations, role-based views, and deeper drill-downs without touching other features
Final Solutions & Key Features
Four tabs organized by Health Equity pillar, each mapping directly to a product package area. Accessible from a new Global Insights menu entry right from the nav.
Tab 1 · Patients & EngagementOverall Patient Reach & Communication Effectiveness
Total messages sent/delivered, delivery success rate, engagement rate, opt-out rate — all trending against the previous period. Plus patient demographics by sex and age, and a language inclusivity breakdown showing both preferred patient languages and languages used in messaging.
Tab 2 · Access to CareBarriers to Care & Appointment Outcomes
Access to Care messaging volume segmented by category. Attributed Members conversion tracking. Full Appointments Summary with cancellation rates and volume breakdowns by location, provider, and template. Patient Satisfaction NPS scores.
Tab 3 · Clinical OutcomesImproved Health Outcomes & Referral Tracking
Clinical messaging volume by category, and a Referral Summary that tracks approved vs. completed referrals, showing how CareMessage supports patients in closing care loops. Breakdown by referral type with unique patient counts.
Tab 4 · Social DeterminantsNon-Medical Patient Support
Messaging volume across Social Determinants of Health categories with patient reach data. Demonstrates CareMessage's full health equity mission beyond clinical care — a differentiator for customers whose board reporting includes non-medical needs metrics.
Impact
Global Insights shipped to production in December 2025. Success is being measured against three defined targets through the end of Q1 2026.
Upon Release
0535%
Adoption rate among active users who have completed the initial discovery
Qualitative Impact
For the first time, CareMessage customers have a single place to see their full health equity impact and not just message delivery stats. C-suite users who previously had to schedule calls with CSMs to build board presentations can now self-serve the data they need. The structure mirrors the product packages they've paid for, creating a direct, visible connection between investment and outcomes every time they log in. The reporting section has been removed from the dashboard, reducing confusion, and the architecture scales cleanly for future work of the CareMessage App redesign and role-based views.
20%
High-value engagement among active users who perform at least one value-driven action (e.g. downloads and drill-downs)
Over 90 Days
3X
Growth in daily unique users, from an average of 20-30 users per day to 60-80+
10%
Of active logins include a Global Insights visit during the session, showing it has become a regular part of the workflow
84%
Of users who arrive at Global Insights make a search, a strong signal that users come with intent and find the experience actionable